
Makita Q2 FY2027: Tariff refunds help lift operating profit 23%

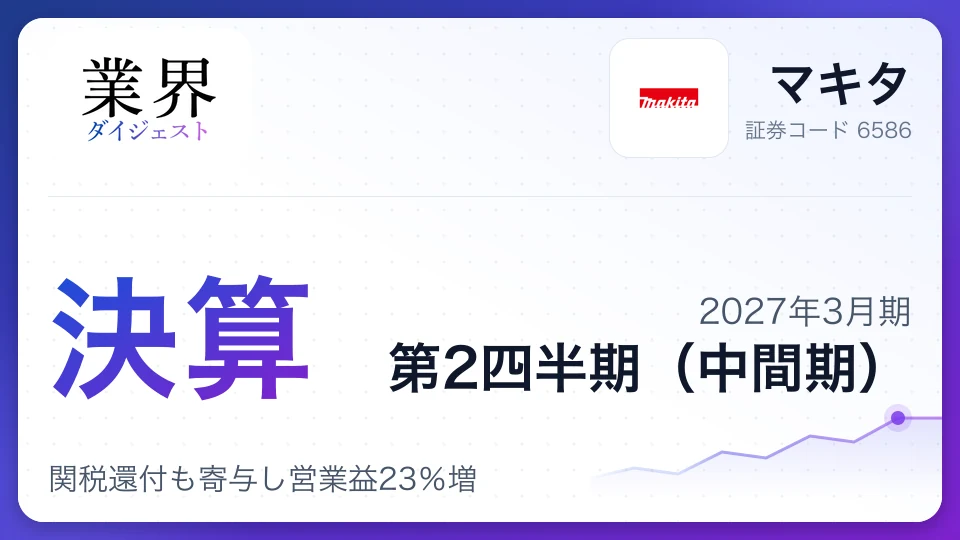
Makita's FY2027 first-half revenue rose 9.6% to ¥414.7 billion, operating profit gained 23.0% to ¥63.3 billion and net income increased 23.5% to ¥47.9 billion. Yen weakness and U.S. tariff refunds supported results.
The numbersSix months to date
First 6 months of the fiscal year, vs. a year earlier
| Actual | YoY | Full-year forecast | Progress | |
|---|---|---|---|---|
| Revenue | ¥414.7B | +9.6% | ¥820.0B | 51% |
| Operating profit | ¥63.3B | +23.0% | ¥110.0B | 58% |
| Net income | ¥47.9B | +23.5% | ¥81.0B | 59% |
| Operating margin | 15.3% | |||
Key takeaways
- 1Revenue rose 9.6% year on year to ¥414.7 billion, also reflecting the weaker yen.
- 2Operating profit increased 23.0%, helped by U.S. tariff refunds and other factors, and the operating margin was 15.3%.
- 3North American regional sales increased 17.9% year on year, helped by promotional activity and other factors.
- 4The full-year forecast was unchanged at revenue of ¥820.0 billion and operating profit of ¥110.0 billion.
- 5The interim dividend was ¥79 per share; the year-end and full-year dividends remain undecided, with a payout ratio policy of at least 50%.
Key results
Makita's FY2027 first-half revenue rose 9.6% year on year to ¥414.7 billion. Operating profit increased 23.0% to ¥63.3 billion, while interim profit attributable to owners of the parent gained 23.5% to ¥47.9 billion. The operating margin improved to 15.3%, from 13.6% a year earlier.
- Revenue growth: Revenue was flat on a local-currency basis, but the yen's depreciation against other currencies lifted the yen-denominated total.
- Profit drivers: An improved cost-of-sales ratio, including refunds of U.S. tariffs, contributed to higher operating profit.
- Costs and earnings: Cost of sales increased year on year, while gross profit rose 19.1%. Selling, general and administrative expenses and other costs also increased, but operating profit grew faster.
A weaker yen and tariff refunds helped drive profit growth in the first half. Makita said revenue was flat in local-currency terms, so the increase should not be read as evidence of a sharp recovery in demand alone. Investors will be watching whether the company can sustain earnings through sales of higher-value products such as the XGT series and cost improvements if the currency tailwind fades.
Segment performance
External-customer revenue increased in North America and Asia. Operating profit fell year on year in Japan, Europe, Asia and Other, while North America rose from a low level a year earlier. The year-on-year comparisons below are based on the segment information in the earnings release.
| Segment | Revenue growth | Operating profit growth |
|---|---|---|
| Japan | +4.6% | -25.6% |
| Europe | +7.7% | -6.4% |
| North America | +17.1% | +2,681.7% |
| Asia | +14.1% | -6.4% |
| Other | +16.0% | -30.2% |
Japan recorded higher revenue but lower operating profit. Europe also grew revenue, but profit declined as high interest rates weighed on subdued building and construction markets. North America posted gains in both revenue and operating profit, although the profit growth rate looks especially large because the year-earlier base was low.
Asia faced generally weak tool demand, with China's property downturn spreading to neighboring countries. Other includes Latin America, Oceania, the Middle East and Africa in the company's regional disclosures. Segment data are based on shipment origin and differ from regional sales data, which reflect sales in each market.
| Segment | Revenue | Share | Operating profit | Operating margin |
|---|---|---|---|---|
| Japan | ¥79.9B | 19% | ¥16.3B | 20.4% |
| Europe | ¥204.2B | 49% | ¥18.8B | 9.2% |
| North America | ¥47.9B | 12% | ¥5.6B | 11.7% |
| Asia | ¥18.6B | 5% | ¥12.4B | 66.8% |
| Other | ¥64.1B | 16% | ¥2.2B | 3.4% |
Full-year outlook
Makita left its FY2027 full-year forecast unchanged. The company expects costs to rise broadly, but said it will focus on developing higher-value businesses and new markets as it works to meet its initial forecasts.
| Item (¥100 million) | Previous forecast | Current forecast | Previous-year result |
|---|---|---|---|
| Revenue | 8,200 | 8,200 | 7,776 |
| Operating profit | 1,100 | 1,100 | 1,047 |
| Profit before tax | 1,110 | 1,110 | 1,080 |
| Net income attributable to owners of the parent | 810 | 810 | 794 |
The revenue forecast represents a 5.5% increase from the previous year, while operating profit is forecast to rise 5.1%. The company made no revisions and assumes full-year exchange rates of ¥155 to the U.S. dollar, ¥180 to the euro and ¥22.5 to the Chinese yuan.
The decision not to raise the forecast despite first-half profit growth suggests caution about rising costs, including raw materials and labor. To assess whether earnings growth can continue in the second half, investors will be watching currency movements, any recovery in building and construction demand, and sales of higher-value products.
Financial position and capital policy
Total assets at the end of the first half stood at ¥1.1921 trillion, up ¥10.9 billion from the previous fiscal year-end. The equity attributable to owners of the parent ratio was 84.2%. Cash flow from operating activities increased from a year earlier, as did cash and cash equivalents.
| Item | FY2027 first-half end or first half | Comparison with previous year-end or year-earlier period |
|---|---|---|
| Equity attributable to owners of the parent ratio | 84.2% | 84.4% at previous year-end |
| Operating cash flow | ¥60.7 billion | +44.3% year on year |
| Investing cash flow | -¥1.6 billion | +¥1.4 billion a year earlier |
| Financing cash flow | -¥42.0 billion | -¥54.3 billion a year earlier |
| Cash and cash equivalents | ¥270.1 billion | +¥12.7 billion from previous year-end |
The interim dividend was ¥79 per share, up from ¥20 a year earlier. The year-end and full-year dividend forecasts remain undecided. Makita's basic policy is to maintain a consolidated payout ratio of at least 50%, with the board scheduled to decide the dividend amount in April 2027.
Makita spent ¥4.1 billion on share buybacks in the first half, down from ¥20.0 billion a year earlier. The company is returning capital through dividends and share repurchases while maintaining increased cash holdings and a high equity ratio. Investing cash flow also includes spending on acquisitions of subsidiaries and business transfers, in addition to purchases of fixed assets.
Research and growth investment
Research and development spending in the first half increased 13.1% year on year to ¥9.1 billion. Capital expenditure was below the year-earlier level, but the full-year plan is higher than the previous year's actual spending, reflecting plans to invest in research and development and production capacity.
- Research and development: First-half spending was ¥9.1 billion, up from ¥8.1 billion a year earlier. The full-year plan is ¥18.5 billion, above the previous year's actual ¥16.6 billion.
- Capital expenditure: First-half spending was ¥10.3 billion, below ¥11.2 billion a year earlier. The full-year plan is ¥30.0 billion, above the previous year's actual ¥21.5 billion.
- Depreciation and amortization: First-half spending was ¥12.7 billion, up from ¥12.3 billion a year earlier.
Makita is expanding its lineup of power tools and outdoor power equipment, with a focus on the high-power, high-durability 40Vmax lithium-ion XGT battery platform. The company sees cordless outdoor power equipment as a future growth pillar alongside power tools. Developing markets beyond construction and addressing decarbonization are also part of its growth investment strategy.
Risks and challenges
Makita cited geopolitical risks, persistently high energy prices and continued high interest rates as economic concerns. Although revenue and profit increased in the first half, neither a demand recovery nor favorable currency movements are assured going forward.
- Geopolitical risks: Heightened tensions, including in the Middle East, could weigh on economic activity and affect sales or logistics in some regions.
- High interest rates and construction demand: Continued weakness in building and housing-related demand in Japan, Europe, North America and elsewhere could hold back a recovery in power-tool sales.
- Foreign-exchange movements: Yen weakness against local currencies contributed to first-half revenue growth. A stronger yen could reduce the yen value of overseas sales and weigh on profit.
- Rising costs and supply chain: The company expects costs to rise broadly. Overseas production accounts for 92.9% of total output, making a production system that can respond flexibly to geopolitical shifts and sudden changes in demand a key challenge.
- Regional differences in demand: Regional sales in the Middle East and Africa fell 9.8% year on year. Sales strategies need to reflect differences in demand and market conditions across regions.
Share price around the earnings release
Close on earnings release (Oct 30, 2026)
¥5,264
Latest close (Oct 30, 2026)
¥5,264
Reference chart of daily closing prices, not real-time quotes (split-adjusted; weekly closes before the last year). Updated Oct 30, 2026.
Compare Makita with its rivals
Pay, results and share price side by side- vsMakita vs TakeuchiMakita has 3.5x the revenueTakeuchi margin 3.3pt higherMakita pays ¥1.00M moreCompare

- vsMakita vs YamabikoMakita has 4.5x the revenueMakita margin 2.1pt higherYamabiko pays ¥0.54M moreCompare

- vsMakita vs MAXMakita has 7.8x the revenueMAX margin 4.2pt higherMAX pays ¥2.48M moreCompare

The Electronics industry now
59 companiesMakita is one of 59 Electronics companies we cover, #21 by revenue. Here is how the industry’s shares and company plans look:
- Industry shares, 1 year
- +15.4%All industries +14.9%
- Op. profit plan, this FY
- +22.9%All industries +13.0%
- Forecasts raised
- 23cut 3
- Industry op. margin
- 10.6%
- Makita+12.6%
- Electronics (average)+15.4%
- All industries+14.9%
- Latest resultsYear to date through Q1, 25 companies combined: revenue +9.2%, operating profit +57.8% year over year. 13 are ahead of an even pace toward their full-year plan, 21 behind.
- Revisions23 raised and 3 cut this year's forecast. The biggest revision: Murata (operating profit +36.8%).





Tags#Makita#earnings#FY2027 results#power tools#XGT series#currency impact#tariff refunds#dividends
Was this article useful?
Anonymous, no sign-up neededComments
Profit grew faster than revenue, and the improvement in the cost-of-sales ratio from U.S. tariff refunds was a positive. However, Makita said sales were flat on a local-currency basis, meaning foreign exchange contributed to first-half revenue growth. Second-half sales trends will be key to judging whether demand is recovering in earnest and profit growth can continue.
Keeping the full-year forecast unchanged and leaving the year-end dividend undecided point to a cautious view of rising costs and market conditions. Investors will be watching whether expanding sales of higher-value products can strengthen earnings without relying on currency tailwinds or tariff refunds.
Cite or share this article
Quoting is free, no permission needed — just credit the source
https://www.gyokaidigest.com/en/companies/makita/report/2027-Q2
Related articles
More on Makita
- IndustryQ1 FY2027Power Tools and Compact Construction Equipment Q1 FY2027: Makita gains, Takeuchi falters
- IndustryFY2026Power Tool & Compact Equipment Majors FY2026 Full Year: Takeuchi beats Makita on margins
- Share Buyback DecisionOct 30, 2026Makita: Sets ¥40bn buyback cap, up to 10m shares by March 2027
Latest from Power Tools & Compact Machinery
- EarningsTakeuchiQ2 FY2027Takeuchi Q2 FY2027: Orders Surge 48% But Tariffs Weigh on Margins
- EarningsSonyQ1 FY2027Sony Q1 FY2027: Operating Profit Jumps 40%, Full-Year Forecast Lifted
- Simultaneous Disclosure of Important MattersTakeuchiOct 13, 2026Takeuchi: Forecast Raised on US Tariff Refund, Dividend Hike
Power Tools & Compact Machinery
Company
Makita Corporation
TSE: 6586
This is the latest earnings analysis
Next earnings date
Rivals reporting soon
609 companies report in the next two weeks · see the scheduleOther periods
2 periods- Q2 FY2027
- Q1 FY2027
Latest earnings coverage
- TRUSCOQ3 FY2026TRUSCO Q3 FY2026: Sales jump 12%, but profit growth trails

- NxeraQ3 FY2026Nxera Q3 FY2026: Returns to profit as partnership income grows

- Genki GlobalQ2 FY2027Genki Global Q2 FY2027: Revenue jumps 42%, profit falls

- transcosmosQ2 FY2027transcosmos Q2 FY2027: Revenue rises as earnings slide on investment

- GenkyQ1 FY2027Genky Q1 FY2027: Sales rise, but profits fall as costs mount
