Genky Q1 FY2027: Sales rise, but profits fall as costs mount

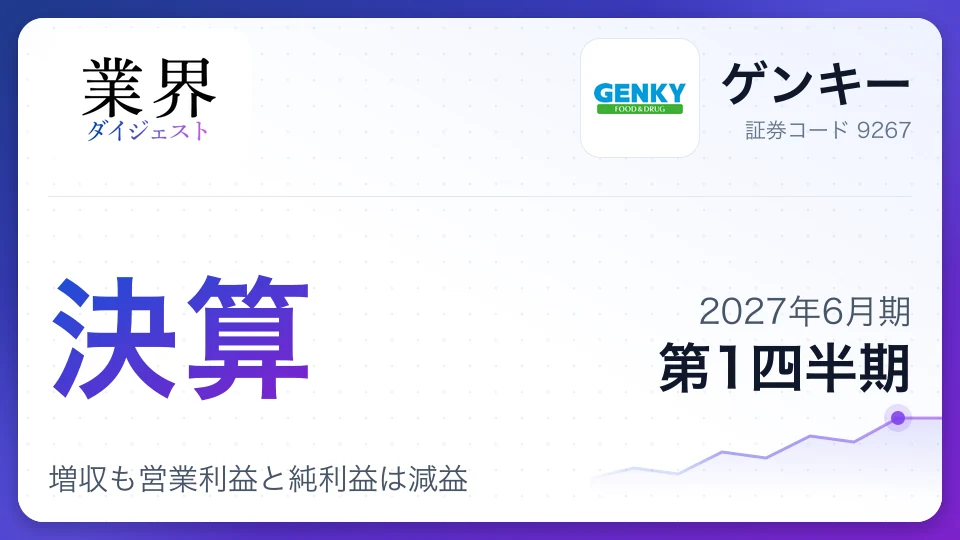
Genky's FY2027 first-quarter revenue rose 6.2% to ¥59.503 billion, while operating profit fell 5.3% to ¥2.762 billion and net income dropped 7.8% to ¥1.878 billion. New stores boosted sales, but higher expenses weighed on earnings.
The numbersThree months to date
First 3 months of the fiscal year, vs. a year earlier
| Actual | YoY | Full-year forecast | Progress | |
|---|---|---|---|---|
| Revenue | ¥59.5B | +6.2% | ¥244.0B | 24% |
| Operating profit | ¥2.8B | -5.3% | ¥12.0B | 23% |
| Net income | ¥1.9B | -7.8% | ¥8.2B | 23% |
| Operating margin | 4.6% | |||
Earnings highlights
Genky posted higher sales but lower profits in the first quarter of FY2027. Revenue rose 6.2% from a year earlier to ¥59.503 billion, operating profit fell 5.3% to ¥2.762 billion, and net income attributable to owners of the parent declined 7.8% to ¥1.878 billion.
- Revenue: Increased ¥3.46 billion year on year, supported by new store openings and sales of daily necessities.
- Gross profit: Increased ¥757 million from a year earlier.
- Selling, general and administrative expenses: Rose ¥910 million year on year, outpacing the increase in gross profit.
- Ordinary profit: Fell 7.4% to ¥2.74 billion. The decline in operating profit and higher non-operating expenses, including interest payments, contributed to the decrease.
Sales growth did not translate into higher profits. Genky is discounting daily necessities and pursuing a low-cost operating model to meet consumers' increased focus on savings amid rising prices. Sales grew, but higher expenses eroded earnings, making it important for the company to balance store expansion with cost control.
- Year-earlier quarter¥292bn
- Gross profit+¥75.7bn
- SG&A expenses-¥91bn
- Other-¥0.1bn
- Current quarter¥276bn
Business-line performance
Retail is Genky's sole business segment, selling pharmaceuticals, cosmetics, household goods and food. The company does not disclose performance by segment, so the breakdown of its business can be seen through sales by product category and store format.
| Product category | Sales (¥ million) |
|---|---|
| Food | 42,043 |
| Household goods | 6,971 |
| Cosmetics | 5,652 |
| Pharmaceuticals | 4,368 |
| Other | 466 |
Food is the largest sales category, as Genky focuses on products needed for everyday life amid consumers' efforts to save. The company opened nine R stores in Aichi, Gifu, Fukui and Shiga prefectures, closed two large-format stores and converted two more stores to the R format. At quarter-end, Genky had 517 R stores and 24 large-format stores, for a total of 541. It aims to build market share through concentrated openings in neighboring areas.
- R stores¥55.3bn
- Large-format stores¥4.1bn
- Other¥0.1bn
Risks and challenges
Genky cited an uncertain economic environment, including rising prices and consumers' increased focus on savings. Its ability to continue opening stores while protecting profitability will be important to watch.
- Consumer thrift: Rising prices have made consumers more cautious and could shift demand and product mix.
- Higher costs: SG&A expenses increased more than gross profit, pushing operating profit below the year-earlier level.
- Store expansion and operations: As Genky opens stores in concentrated areas and renovates locations, it will need to maintain low-cost operations and generate sales and profits that justify its investments.
Sales growth and margin recovery are in focus. Genky has not changed its earnings forecast, so investors will need to track not only sales growth in coming quarters but also whether the company can contain expense increases and convert sales into profit.
Share price around the earnings release
Close on earnings release (Oct 30, 2026)
¥3,395
Latest close (Oct 30, 2026)
¥3,395
Reference chart of daily closing prices, not real-time quotes (split-adjusted; weekly closes before the last year). Updated Oct 30, 2026.
Compare Genky with its rivals
Pay, results and share price side by side
The Retail industry now
56 companiesGenky is one of 56 Retail companies we cover, #47 by revenue. Here is how the industry’s shares and company plans look:
- Industry shares, 1 year
- +3.5%All industries +14.9%
- Op. profit plan, this FY
- +11.2%All industries +13.0%
- Forecasts raised
- 6cut 1
- Industry op. margin
- 6.3%
- Genky−33.8%
- Retail (average)+3.5%
- All industries+14.9%
- Latest resultsYear to date through Q1, 23 companies combined: revenue +10.7%, operating profit +21.0% year over year. 16 are ahead of an even pace toward their full-year plan, 9 behind.
- Revisions6 raised and 1 cut this year's forecast. The biggest revision: YONDOSHI (operating profit +19.4%).





Was this article useful?
Anonymous, no sign-up neededCite or share this article
Quoting is free, no permission needed — just credit the source
https://www.gyokaidigest.com/en/companies/genky-drugstores/report/2027-Q1
Related articles
Latest from Food-Focused Drugstores
- EarningsCosmosQ1 FY2027Cosmos Q1 FY2027: Sales Top Record as Low-Price Strategy Drives Growth Amid Margin Pressure
- EarningsKusuri no AokiQ1 FY2027Kusuri no Aoki Q1 FY2027: Revenue Surges 36.4% to Record High Amid Tight Competition

- EarningsAEONQ2 FY2027AEON Q2 FY2027: Health business drives record operating profit to 130.7 billion yen
- Business Performance OverviewAEONOct 13, 2026AEON: AEON September Same-Store Sales Rise Third Straight Month on Strong Mall Growth
Food-Focused Drugstores
Company
Genky DrugStores Co., Ltd.
TSE: 9267
This is the latest earnings analysis
Next earnings date
Latest earnings coverage
- TRUSCOQ3 FY2026TRUSCO Q3 FY2026: Sales jump 12%, but profit growth trails

- NxeraQ3 FY2026Nxera Q3 FY2026: Returns to profit as partnership income grows

- Genki GlobalQ2 FY2027Genki Global Q2 FY2027: Revenue jumps 42%, profit falls

- transcosmosQ2 FY2027transcosmos Q2 FY2027: Revenue rises as earnings slide on investment

- OricoQ2 FY2027Orico Q2 FY2027: Higher funding costs drive 43.7% net profit drop