
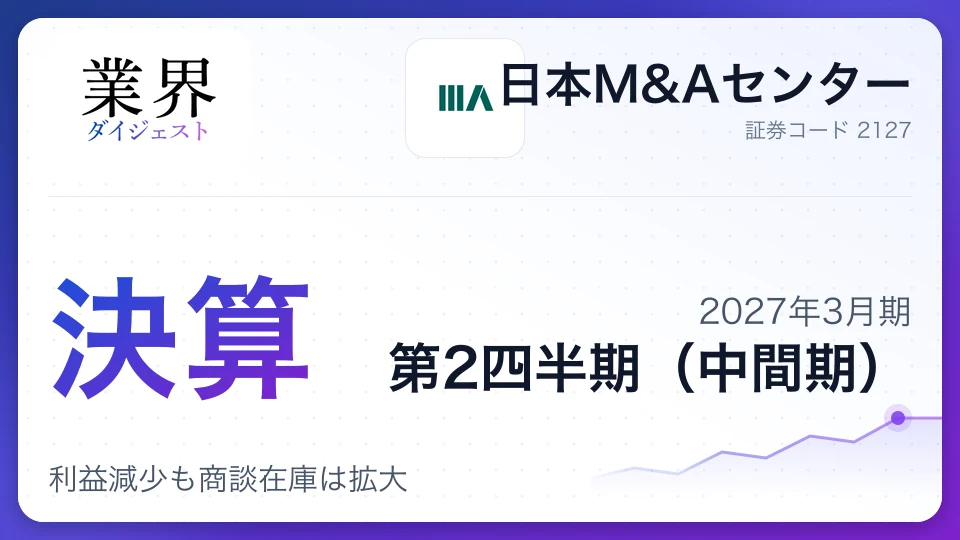
Nihon M&A Center Q2 FY2027: Profit falls as deal pipeline expands

Nihon M&A Center reported nearly flat revenue and lower profit for FY2027’s first half, with sales up 0.1% year on year to ¥22.599 billion. Operating profit fell 6.0% to ¥7.896 billion and net income declined 1.9% to ¥5.305 billion, while its deal pipeline grew.
The numbersSix months to date
First 6 months of the fiscal year, vs. a year earlier
| Actual | YoY | Full-year forecast | Progress | |
|---|---|---|---|---|
| Revenue | ¥22.6B | +0.1% | ¥52.8B | 43% |
| Operating profit | ¥7.9B | -6.0% | ¥19.3B | 41% |
| Net income | ¥5.3B | -1.9% | ¥13.4B | 40% |
| Operating margin | 34.9% | |||
Key takeaways
- 1First-half deal completions totaled 478, down 2.0% year on year; July-September completions were 290, up 5.1%.
- 2New seller mandates reached 699, up 13.5%; mid-cap mandates totaled 155, up 30.3%.
- 3The deal pipeline was about 22% larger at the end of September than at the same point a year earlier, positioning the company for more completions in the second half.
- 4The annual dividend forecast is ¥29 per share, unchanged from the previous year, including a planned special dividend of ¥4.
- 5The full-year forecast was unchanged, with revenue of ¥52.8 billion and operating profit of ¥19.3 billion.
Key results
Nihon M&A Center Holdings posted a 0.1% year-on-year increase in interim revenue, while operating profit fell 6.0% and net income attributable to owners of the parent declined 1.9%. Higher selling, general and administrative expenses weighed on earnings despite nearly flat sales. Higher costs weigh on earnings as revenue stays flat
| Metric | Year-on-year change | Change in amount |
|---|---|---|
| Revenue | +0.1% | +¥12 million |
| Operating profit | -6.0% | -¥503 million |
| Ordinary profit | -8.0% | -¥687 million |
| Interim net income | -1.9% | -¥105 million |
Cost of sales fell 1.2% from a year earlier, reflecting lower referral fees and outsourcing costs. But selling, general and administrative expenses rose 11.1%, driven by advertising for the company's 35th-anniversary campaign and higher IT costs as it advances data-driven management.
The number of completed deals in the first half was below the year-earlier level, but deals generating success fees of at least ¥100 million increased, and revenue per M&A deal remained high. Deal completions rose from the first quarter to the second. The company plans to maintain the quality of mandates while converting its growing pipeline into completed transactions.
Segment performance
The core M&A consulting business recorded a 0.1% decline in revenue from external customers and a 5.2% drop in segment profit from a year earlier. The smaller fund business increased revenue by 53.6% and swung to a segment profit from a loss a year earlier.
M&A consulting business: First-half cumulative deal completions were below the year-earlier level, but the number of large deals rose 15.2% and revenue per deal increased 2.2%. With new mandates and the deal pipeline growing, the company aims to increase completions in the second half. Higher advertising and IT costs, however, weighed on profit.
Fund business: Revenue from external customers increased 53.6% year on year, and the segment swung to a profit from a loss a year earlier. Gains from the sale of an investment recorded in the first quarter boosted profit, so the result should be considered separately from growth in recurring business revenue. In April 2026, the company established J-Capital, an intermediate holding company overseeing the business, as it builds the fund operation into a second earnings pillar for the group.
| Segment | Revenue | Share | Operating profit | Operating margin |
|---|---|---|---|---|
| M&A Consulting Business | ¥22.5B | 100% | ¥8.4B | 37.3% |
| Fund Business | ¥86M | 0% | ¥555M | 645.3% |
Financial position and capital policy
Total assets stood at ¥60.86 billion at the end of September, down 8.1% from the end of March. The equity ratio rose to 83.9%, from 75.8% at the end of March. Operating cash flow was below the year-earlier level, while investing cash flow turned positive.
| Metric | End of September 2026 / interim | End of March 2026 / prior-year interim |
|---|---|---|
| Total assets | ¥60.86 billion | ¥66.223 billion |
| Equity ratio | 83.9% | 75.8% |
| Operating cash flow | ¥1.939 billion | ¥4.672 billion |
| Investing cash flow | ¥2.362 billion | -¥3.2 billion |
| Financing cash flow | -¥5.781 billion | -¥5.451 billion |
The decline in operating cash flow was partly affected by payments of accrued expenses. Major financing cash outflows were dividend payments and loan repayments. Cash and deposits fell from the end of March, but the high equity ratio leaves the company with a solid financial base.
The company forecast an annual dividend of ¥29 per share, unchanged from the previous year's actual payout. The interim dividend comprises an ordinary dividend of ¥12 and a special dividend of ¥2. The year-end forecast is an ordinary dividend of ¥13 and a special dividend of ¥2, bringing the planned special dividend for the year to ¥4. The earnings release did not announce a share buyback.
Full-year outlook
Nihon M&A Center left its full-year forecast for the year ending March 2027 unchanged. It expects revenue to rise 5.1% from the previous year, operating profit to increase 2.9% and net income attributable to owners of the parent to grow 7.3%.
| Metric | Previous forecast | Current forecast | Previous-year actual |
|---|---|---|---|
| Revenue | ¥52.8 billion | ¥52.8 billion | ¥50.185 billion |
| Operating profit | ¥19.3 billion | ¥19.3 billion | N/A |
| Net income | ¥13.4 billion | ¥13.4 billion | N/A |
Interim results represented 94.6% of the company's plan for revenue, 91.8% for operating profit and 85.6% for net income. First-half deal completions were below the year-earlier level, but the pipeline was about 22% larger than at the same point last year.
The company plans to tighten management of deal processes and prioritize the quality of mandates as it converts pipeline opportunities into completed transactions. Its ability to turn those opportunities into deals in the second half will be important to meeting the full-year forecast.
Strategy
Nihon M&A Center has designated this year as the start of a "second founding" and is building its sales organization and growth platform toward a target of ¥30 billion in consolidated ordinary profit for the year ending March 2033. Its initiatives include using AI, deepening ties with regional financial institutions and expanding its reach among mid-cap companies and overseas markets.
- AI-powered deal analysis: Its Bring Out AI meeting-analysis service has compiled information on about 3,700 sellers and 13,500 potential buyers, generating about 13,000 matches. The company has also completed its first deal sourced through AI.
- In-house AI capabilities: The company decided to make AI Brain Partners a wholly owned subsidiary through a share exchange scheduled for Nov. 2, 2026.
- North American expansion: A strategic business alliance with U.S.-based Generational Group, which has strengths in the North American mid-cap market, will bolster support in North America in addition to Japan and ASEAN.
- Regional and mid-cap growth: The company is expanding its reach to regional clients through, among other channels, 14 satellite offices nationwide. A specialist team for mid-cap companies supports subsidiary sales and business carve-outs.
Investment in AI and overseas expansion is intended to improve matching and deal sourcing efficiency and support future growth. For now, higher costs are weighing on profit, making the impact of these investments on completion rates and profitability a key measure to watch.
Risks and challenges
M&A brokerage deals can take time to move from mandate to completion, so shifts in closing timing can affect results. The company has also cautioned that its forecasts are based on certain assumptions and actual performance may vary for a range of reasons.
- Timing of deal completions: First-half completed deals fell 2.0% year on year. If the larger pipeline does not translate into more completions in the second half, meeting the full-year plan could become difficult.
- Reliance on success fees: Success fees account for a large share of first-half revenue. Revenue and profit can fluctuate depending on the timing of large deals and transaction closings.
- Higher costs and margins: Increased advertising and IT spending contributed to a decline in the ordinary profit margin to 34.9% from 37.9% a year earlier. Costs may continue to weigh on earnings until growth investments deliver sufficient returns.
- Earnings volatility from investments: Gains from the sale of investments can boost profit in the fund business. Results may therefore fluctuate from period to period depending on whether and when assets are sold.
Share price around the earnings release
Close on earnings release (Oct 30, 2026)
¥619.5
Latest close (Oct 30, 2026)
¥619.5
Reference chart of daily closing prices, not real-time quotes (split-adjusted; weekly closes before the last year). Updated Oct 30, 2026.
Compare Nihon M&A Center with its rivals
Pay, results and share price side by side- vsNihon M&A Center vs Strike GroupNihon M&A Center has 1.9x the revenueStrike Group margin 1.1pt higherCompare

- vsNihon M&A Center vs SIGMAXYZNihon M&A Center has 2.1x the revenueNihon M&A Center margin 11.9pt higherCompare
- vsNihon M&A Center vs M&A CapitalNihon M&A Center has 2.2x the revenueNihon M&A Center margin 2.7pt higherCompare

The Other Services industry now
19 companiesNihon M&A Center is one of 19 Other Services companies we cover, #16 by revenue. Here is how the industry’s shares and company plans look:
- Industry shares, 1 year
- +18.3%All industries +14.9%
- Op. profit plan, this FY
- +21.1%All industries +13.0%
- Forecasts raised
- 5cut 0
- Industry op. margin
- 11.4%
- Nihon M&A Center−14.7%
- Other Services (average)+18.3%
- All industries+14.9%
- Latest resultsYear to date through Q1, 11 companies combined: revenue +8.9%, operating profit +51.7% year over year. 1 are ahead of an even pace toward their full-year plan, 4 behind.
- Revisions5 raised and 0 cut this year's forecast. The biggest revision: Recruit (operating profit +20.1%).






Tags#Nihon M&A Center#earnings#M&A advisory#deal completions#M&A pipeline#fund business#full-year forecast#dividend
Was this article useful?
Anonymous, no sign-up neededComments
Revenue was nearly flat and profit declined in the first half, but growth in new mandates and the deal pipeline points to room for a recovery in the second half. Gains in mid-cap and large deals also fit a strategy that targets not only deal volume but also transaction value.
Still, a larger pipeline does not in itself translate into revenue or profit. The key tests for the full-year forecast and the company's "second founding" will be whether completion rates improve enough to absorb higher advertising and IT investment, and whether the company can grow earnings without relying on gains from fund exits.
Cite or share this article
Quoting is free, no permission needed — just credit the source
https://www.gyokaidigest.com/en/companies/nihon-ma-center/report/2027-Q2
Related articles
More on Nihon M&A Center
- IndustryQ1 FY2027Consulting and Think Tanks Q1 FY2027: BayCurrent leads on growth
- Third-Party Committee ReportOct 30, 2026Nihon M&A Center: Interim dividends exceeded legal limits by ¥905m
- Past Dividend IrregularityOct 8, 2026Nihon M&A Center: Sets Up Probe Into Excess Dividends Paid in Dec 2024, 2025
- Prior Dividend CorrectionOct 5, 2026Nihon M&A Center: Exceeds Distributable Amount by 830M Yen, Sets Probe Panel
Latest from Consulting & Think Tanks

Consulting & Think Tanks


Company
Nihon M&A Center Holdings Inc.
TSE: 2127
This is the latest earnings analysis
Next earnings date
Rivals reporting soon
609 companies report in the next two weeks · see the scheduleOther periods
2 periods- Q2 FY2027
- Q1 FY2027
Latest earnings coverage
- TRUSCOQ3 FY2026TRUSCO Q3 FY2026: Sales jump 12%, but profit growth trails

- NxeraQ3 FY2026Nxera Q3 FY2026: Returns to profit as partnership income grows

- Genki GlobalQ2 FY2027Genki Global Q2 FY2027: Revenue jumps 42%, profit falls

- transcosmosQ2 FY2027transcosmos Q2 FY2027: Revenue rises as earnings slide on investment
- GenkyQ1 FY2027Genky Q1 FY2027: Sales rise, but profits fall as costs mount
