
NEG Q3 FY2026: Operating profit drops 34%, net income falls 42%

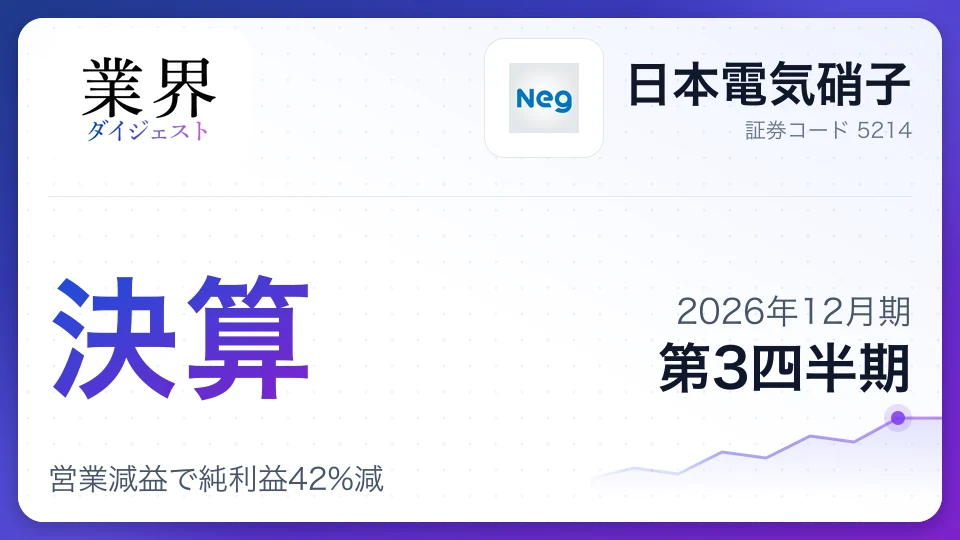
NEG reported revenue up 0.2% to ¥232.4 billion for the nine months to September 2026, while operating profit fell 33.9% to ¥16 billion and net income dropped 41.9% to ¥9.6 billion. Higher costs and restructuring weighed on earnings.
The numbersNine months to date
First 9 months of the fiscal year, vs. a year earlier
| Actual | YoY | Full-year forecast | Progress | |
|---|---|---|---|---|
| Revenue | ¥232.5B | +0.2% | ¥300.0B | 77% |
| Operating profit | ¥16.1B | -33.9% | ¥20.0B | 80% |
| Net income | ¥9.7B | -41.9% | ¥15.0B | 65% |
| Operating margin | 6.9% | |||
Key takeaways
- 1Electronics and Information revenue rose 5% year on year to ¥133.4 billion, while Functional Materials revenue fell 6% to ¥99 billion.
- 2Operating profit declined ¥8.2 billion year on year, pressured by higher display-business costs and raw material and fuel prices.
- 3Business restructuring costs rose to ¥15.7 billion from ¥3.6 billion a year earlier, weighing on net income.
- 4NEG left its full-year forecast unchanged at ¥300 billion in revenue and ¥20 billion in operating profit, with operating profit expected to fall 41.4% from the previous year.
- 5The annual dividend forecast increased to ¥160 from ¥150 in the previous year, and share buybacks are continuing.
Earnings highlights
For the nine months ended September 2026, NEG posted revenue of ¥232.4 billion, up 0.2% year on year. Operating profit fell 33.9% to ¥16 billion, while net income attributable to owners of the parent declined 41.9% to ¥9.6 billion. Revenue was nearly flat, but profitability weakened despite sales growth.
| Item | Change from prior-year period (¥100 million) |
|---|---|
| Revenue | +3 |
| Operating profit | -82 |
| Ordinary profit | -36 |
| Net income attributable to owners of the parent | -69 |
The main pressures on operating profit were higher raw material and fuel costs, along with increased expenses related to the display business's transition to all-electric melting equipment and scheduled maintenance. Start-up costs for medical glass manufacturing facilities also weighed on earnings.
Net income included special losses tied to the restructuring of the composites business, including the suspension and transfer of production at a U.S. subsidiary. Gains from the sale of investment securities and fixed assets were not enough to offset those costs, leaving net income below the prior-year level.
Performance by business line
NEG reports a single glass business segment. By product area, Electronics and Information grew, while Functional Materials, which includes the composites business undergoing restructuring, recorded lower sales.
| Product area | Revenue (¥100 million) | Year-on-year | Change (¥100 million) |
|---|---|---|---|
| Electronics and Information | 1,334 | +5% | +62 |
| Functional Materials | 990 | -6% | -58 |
Electronics and Information benefited from steady display demand. Sales of electronic devices also increased across information and communications, automotive and consumer electronics applications, led by data center demand. Growth in information and communications helped offset the decline in Functional Materials.
Functional Materials sales fell at sites in Europe and the U.S. as NEG restructured its composites business. Revenue in medical, heat-resistant and construction materials was broadly in line with the prior-year period. The focus ahead will be on improving profitability through restructuring and expanding sales of new products.
Financial position and capital policy
Total assets stood at ¥656.4 billion at the end of September 2026, down ¥45 billion from the end of 2025. The equity ratio rose to 73.4% from 70.2%, while NEG also reduced its liabilities.
| Item | End of 2025 | End of September 2026 / forecast | Change / comparison |
|---|---|---|---|
| Total assets (¥100 million) | 7,014 | 6,564 | -450 |
| Equity ratio | 70.2% | 73.4% | +3.2 percentage points |
| Cash and deposits (¥100 million) | 1,207 | 1,082 | -125 |
| Annual dividend (yen) | 150 | 160 (forecast) | +10 yen |
| Treasury shares held during period (10,000 shares) | 1,429 | 1,706 | +277 |
The decline in cash and deposits reflected capital investment, share buybacks and dividend payments. Bond redemptions and loan repayments also contributed to a ¥34.1 billion reduction in liabilities from year-end. NEG does not prepare a quarterly cash flow statement, so details of operating, investing and financing cash flows are not available in its published materials.
The interim dividend rose to 80 yen from 70 yen a year earlier, and the company forecasts an 80-yen year-end dividend. The full-year dividend forecast is unchanged. Share repurchases are being carried out under a board resolution, but the earnings release does not disclose the amount spent.
Full-year outlook
NEG left its full-year forecast for the fiscal year ending December 2026 unchanged from the projection announced on July 31. It expects revenue to decline 3.7% from the previous year, operating profit to fall 41.4% and net income to drop 49.4%.
| Item (¥100 million) | Previous forecast | Current forecast | Previous-year result |
|---|---|---|---|
| Revenue | 3,000 | 3,000 | 4,923.71 |
| Operating profit | 200 | 200 | Not disclosed in the earnings release |
| Net income attributable to owners of the parent | 150 | 150 | Not disclosed in the earnings release |
For the fourth quarter, NEG expects display demand to soften, while sales of electronic devices for semiconductors and information and communications are expected to expand. In Functional Materials, restructuring at the U.S. subsidiary is expected to cause a substantial decline in composites sales, while the company continues to ramp up equipment for low-dielectric glass fiber.
NEG expects higher raw material and fuel costs due to the Middle East situation and yen depreciation, and plans to contain the increase through price revisions and productivity improvements. Nine-month net income is progressing slowly against the full-year forecast. The impact of restructuring costs and a fourth-quarter earnings recovery will be key to meeting the target.
Growth investment and restructuring
NEG is working to improve profitability in existing businesses while strengthening supply capacity in electronic materials. Restructuring costs are weighing on earnings this fiscal year, but the company plans to continue ramping up facilities for growth markets.
- Composites restructuring: NEG recorded ¥15.7 billion in business restructuring costs, including the suspension and transfer of production at its U.S. subsidiary. That was up from ¥3.6 billion in the prior-year period.
- Low-dielectric glass fiber: The company is bringing manufacturing equipment for electronic materials into operation, with plans to build sales over time.
- Display equipment: NEG is transitioning to all-electric melting equipment, but the transition and scheduled maintenance increased costs and pressured operating profit during the period.
- Medical glass: Manufacturing equipment is being ramped up at a Malaysian subsidiary, resulting in costs during the initial operating phase.
Restructuring is bringing short-term costs and lower sales, but NEG also aims to contain cost increases through price revisions and productivity improvements. Investors will be watching when the new equipment reaches stable operation and whether the post-restructuring businesses deliver improved profitability.
Risks and challenges
The full-year outlook depends on uncertain factors including the Middle East situation, foreign exchange rates and demand trends. Higher raw material and fuel costs, together with the restructuring of the composites business, could delay an earnings recovery.
- Rising raw material and fuel prices: NEG expects prices to climb amid the Middle East situation and yen depreciation. If price revisions and productivity improvements do not offset the increase, profit margins will face further pressure.
- Composites restructuring: Sales at European and U.S. sites are declining as the U.S. subsidiary suspends and transfers production. Further sales declines and additional costs are possible in the near term.
- Softer display demand: The company expects demand to weaken in the fourth quarter. The extent to which sales of electronic devices for semiconductor and information and communications applications can offset the decline will be a key focus.
- Foreign exchange and global economic volatility: Currency movements, interest rates, trade restrictions and sudden shifts in supply and demand in individual markets could affect overseas operations and product sales.
Share price around the earnings release
Close on earnings release (Oct 30, 2026)
¥4,979
Latest close (Oct 30, 2026)
¥4,979
Reference chart of daily closing prices, not real-time quotes (split-adjusted; weekly closes before the last year). Updated Oct 30, 2026.
Compare NEG with its rivals
Pay, results and share price side by side- vs
 NGK Insulators vs NEGNGK Insulators has 2.0x the revenueNGK Insulators margin 2.2pt higherNGK Insulators pays ¥1.42M moreCompare
- vs
 Niterra vs NEGNiterra has 2.3x the revenueNiterra margin 7.9pt higherNiterra pays ¥2.84M moreCompare
- vsNEG vs NittoboNEG has 2.6x the revenueNittobo margin 6.6pt higherNittobo pays ¥0.45M moreCompare

The Glass & Ceramics industry now
17 companiesNEG is one of 17 Glass & Ceramics companies we cover, #7 by revenue. Here is how the industry’s shares and company plans look:
- Industry shares, 1 year
- +25.4%All industries +14.9%
- Op. profit plan, this FY
- +13.9%All industries +13.0%
- Forecasts raised
- 6cut 1
- Industry op. margin
- 10.0%
- NEG−4.2%
- Glass & Ceramics (average)+25.4%
- All industries+14.9%
- Latest resultsYear to date through Q1, 8 companies combined: revenue +11.7%, operating profit +32.1% year over year. 5 are ahead of an even pace toward their full-year plan, 6 behind.
- Revisions6 raised and 1 cut this year's forecast. The biggest revision: Tokai Carbon (operating profit +34.6%).



Tags#NEG earnings#Japanese stocks#Glass manufacturing#Quarterly results#Business restructuring#Electronic materials#Raw material costs#Dividend
Was this article useful?
Anonymous, no sign-up neededComments
Revenue was nearly flat, but operating profit fell sharply, making cost structure and portfolio changes more important to this quarter's results than demand strength alone. Growth in Electronics and Information helped offset weakness in Functional Materials, but higher raw material and fuel costs and expenses tied to equipment transitions more than absorbed the gains.
The composites restructuring is bringing lower sales and higher costs in the short term, even as NEG invests in growth areas such as low-dielectric glass fiber. Investors will want to track not only when restructuring costs taper off, but also whether new facilities reach stable operation and translate into sales and earnings growth.
A higher equity ratio and increased dividend provide support on the balance sheet and shareholder-return fronts, but net income is further behind the full-year target than operating profit. How effectively price revisions and productivity improvements contain costs in the fourth quarter will be central to whether NEG meets its forecast and sustains a recovery into the next fiscal year.
Cite or share this article
Quoting is free, no permission needed — just credit the source
https://www.gyokaidigest.com/en/companies/nippon-electric-glass/report/2026-Q3
Related articles
Latest from Glass & Electronic Ceramics
- EarningsAGCQ2 FY2026AGC Q2 FY2026: Net profit surges 155% on glass and electronics recovery
- EarningsNGK InsulatorsQ2 FY2027NGK Insulators Q2 FY2027: AI demand drives 43.5% rise in operating profit
- EarningsNiterraQ2 FY2027Niterra Q2 FY2027: Raises outlook on AI chip demand, yen weakness
- EarningsMARUWAQ1 FY2027MARUWA Q1 FY2027: Record Revenue and Profit on AI, Telecom Demand

- Earnings and Dividend Forecast RevisionNGK InsulatorsOct 30, 2026NGK Insulators: FY2027 net profit forecast raised to ¥100bn
- Shareholder Returns and DividendsNiterraOct 30, 2026Niterra: Sets 6% DOE target, raises annual dividend forecast
Glass & Electronic Ceramics
Company
Nippon Electric Glass Co., Ltd.
TSE: 5214
This is the latest earnings analysis
Next earnings date
Rivals reporting soon
609 companies report in the next two weeks · see the scheduleOther periods
2 periods- Q3 FY2026
- Q2 FY2026
Latest earnings coverage
- TRUSCOQ3 FY2026TRUSCO Q3 FY2026: Sales jump 12%, but profit growth trails

- NxeraQ3 FY2026Nxera Q3 FY2026: Returns to profit as partnership income grows

- Genki GlobalQ2 FY2027Genki Global Q2 FY2027: Revenue jumps 42%, profit falls

- transcosmosQ2 FY2027transcosmos Q2 FY2027: Revenue rises as earnings slide on investment

- GenkyQ1 FY2027Genky Q1 FY2027: Sales rise, but profits fall as costs mount
