
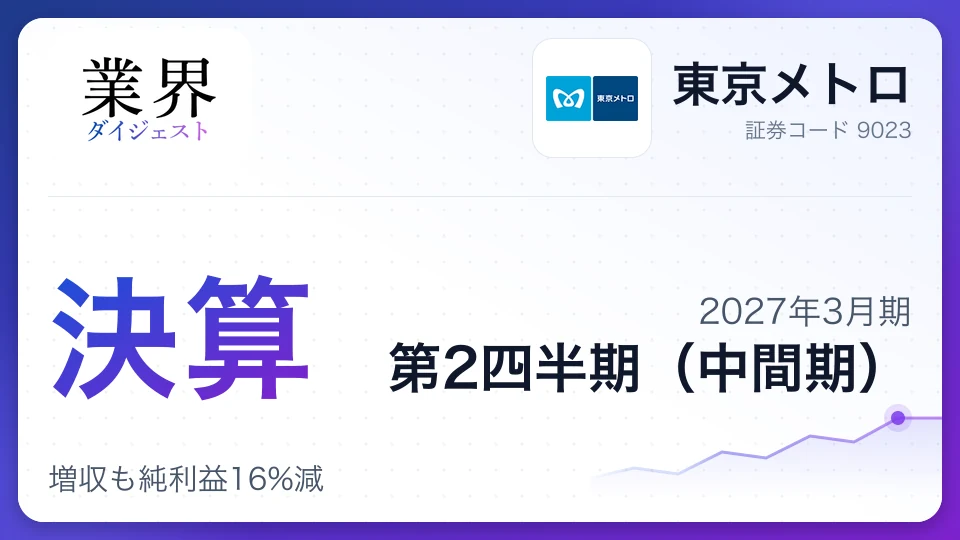
Tokyo Metro Q2 FY2027: Revenue up, net profit falls 16%

Tokyo Metro's FY2027 first-half revenue rose 3.2% year on year, but operating profit fell 1.6% and net income dropped 16.3% as costs climbed. The company kept its full-year outlook unchanged and maintained its annual dividend forecast at ¥44, up ¥2 from the prior year.
The numbersSix months to date
First 6 months of the fiscal year, vs. a year earlier
| Actual | YoY | Full-year forecast | Progress | |
|---|---|---|---|---|
| Revenue | ¥217.3B | +3.2% | ¥437.2B | 50% |
| Operating profit | ¥49.2B | -1.6% | ¥81.4B | 60% |
| Net income | ¥29.2B | -16.3% | ¥50.0B | 58% |
| Operating margin | 22.7% | |||
Key takeaways
- 1Higher passenger revenue lifted operating revenue 3.2%, while rising costs cut operating profit 1.6%.
- 2Transportation operating profit fell 4.8%, while passenger revenue rose 3.0%.
- 3Life and business services operating profit increased 25.1%, the fastest growth among the three businesses.
- 4The full-year operating revenue forecast is ¥437.2 billion and the operating profit forecast is ¥81.4 billion, both unchanged.
- 5The annual dividend forecast is ¥44, up ¥2 from the previous year; the interim dividend is ¥22, up ¥1.
Earnings highlights
Tokyo Metro reported operating revenue of ¥217.2 billion, up 3.2% year on year, for the six months ended September 2026. Operating profit fell 1.6% to ¥49.2 billion, while net income attributable to owners of the parent declined 16.3% to ¥29.2 billion.
- Passenger revenue: Revenue from both commuter-pass and non-pass customers increased, lifting total passenger revenue 3.0%. Passenger numbers rose 2.8%.
- Operating expenses: Costs rose 4.7% to ¥168.0 billion, led by higher personnel expenses and other costs, outpacing revenue growth.
- Net income comparison: The year-earlier period included a ¥6.4 billion extraordinary gain from a revision to the retirement benefit plan. There was no comparable gain this period.
Higher costs and a prior-year one-off weighed on profit despite revenue growth. More passengers and higher transport revenue supported the top line, but rising costs cut into operating profit. Net income fell further, in part because the prior-year period included the extraordinary gain.
Segment performance
The core transportation business grew revenue but posted lower profit, while real estate and life and business services recorded gains in both. Compared with the year-earlier period, the weakness in transportation contrasted with particularly strong growth in life-related services.
Transportation generated operating revenue of ¥197.4 billion and operating profit of ¥40.6 billion. Higher passenger revenue lifted sales, but rising expenses pulled profit below the year-earlier level. Passenger numbers increased, while cost control remains a key focus.
Real estate recorded operating revenue of ¥7.5 billion and operating profit of ¥2.9 billion. Rental income from acquired and newly opened properties, including Metro City Kanda Awajicho and Asakusa Square, contributed to growth in both revenue and profit.
Life and business services posted operating revenue of ¥14.3 billion and operating profit of ¥5.2 billion, the strongest profit growth among the three businesses. Contributions came from rental income at existing stores, the opening of LifeFit, advertising agency production fees and licensing fees associated with new contracts for fifth-generation mobile services. The business is adding growth beyond Tokyo Metro's rail operations.
- Transportation-4.8%
- Real estate+6.7%
- Life and related services+25.1%
| Segment | Revenue | Share | Operating profit | Operating margin |
|---|---|---|---|---|
| Transportation | ¥196.7B | 91% | ¥40.7B | 20.6% |
| Real estate | ¥7.4B | 3% | ¥3.0B | 39.6% |
| Life and business services | ¥13.0B | 6% | ¥5.3B | 37.0% |
| Other | ¥128M | 0% | ¥213M | 10.3% |
Full-year outlook
Tokyo Metro left its consolidated forecast for the fiscal year ending March 2027 unchanged. It expects operating revenue of ¥437.2 billion, up 3.5% from the previous fiscal year, while operating profit is forecast to fall 9.1% to ¥81.4 billion and net income 15.3% to ¥50.0 billion.
| Item | Full-year forecast | Year-on-year change |
|---|---|---|
| Operating revenue (¥ billion) | 437.2 | +3.5% |
| Operating profit (¥ billion) | 81.4 | -9.1% |
| Ordinary profit (¥ billion) | 69.0 | -12.9% |
| Net income (¥ billion) | 50.0 | -15.3% |
The company made no changes to its most recently announced forecast. Revenue increased in the first half, but operating profit declined from a year earlier, leaving investors to watch whether Tokyo Metro can absorb higher costs and meet its full-year targets in the second half. The earnings release did not include the previous fiscal year's full-year results or the prior forecast amounts, so comparisons are shown using the year-on-year rates disclosed by the company.
Financial position and capital policy
Total assets stood at ¥2.0649 trillion at the end of the first half, an increase of ¥17.7 billion from the end of March 2026. The equity ratio rose to 36.4%, from 35.9% at the previous fiscal year-end.
| Item | FY2027 first half | Comparison with previous period or year-earlier period |
|---|---|---|
| Total assets (¥ billion) | 2,064.9 | Up ¥17.7 billion from fiscal year-end |
| Equity ratio | 36.4% | Up 0.5 percentage points from fiscal year-end |
| Operating cash flow (¥ billion) | 57.7 | Down ¥3.3 billion year on year |
| Investing cash flow (¥ billion) | -49.5 | Outflow down ¥1.4 billion year on year |
| Financing cash flow (¥ billion) | 15.5 | Compared with an outflow of ¥30.9 billion a year earlier |
| Annual dividend forecast (yen) | 44 | Up ¥2 from the previous year's ¥42 |
The company generated cash from operations while continuing to spend on investment, mainly equipment. Proceeds from bond issuance contributed to positive financing cash flow, and Tokyo Metro is also acquiring properties for sale and issuing bonds. It forecasts interim and year-end dividends of ¥22 each, for an annual payout ¥2 higher than the previous year. The earnings release did not announce a new share buyback.
Risks and challenges
Passenger numbers and passenger revenue rose in the first half, but operating expenses grew faster, putting pressure on profit. Sustaining demand and managing cost increases will be important to achieving the full-year forecast.
- Higher personnel and other costs: Operating expenses increased 4.7% year on year. If costs continue to rise, passenger revenue growth may translate less effectively into operating profit.
- Transportation profit trends: Operating profit in the core business fell 4.8% despite revenue growth. Balancing passenger and fare revenue gains against the costs of operations and maintaining facilities remains a challenge.
- Interest and funding costs: Interest payments rose to ¥6.3 billion from ¥6.0 billion a year earlier. As the company continues to raise funds, including through bond issuance, changes in interest expenses could affect earnings.
- Uncertainty in the outlook: The company says its forecast is based on information currently available and certain assumptions, and actual results may differ due to various factors.
Share price around the earnings release
Close on earnings release (Oct 30, 2026)
¥1,445.5
Latest close (Oct 30, 2026)
¥1,445.5
Reference chart of daily closing prices, not real-time quotes (split-adjusted; weekly closes before the last year). Updated Oct 30, 2026.
Compare Tokyo Metro with its rivals
Pay, results and share price side by side- vsTokyo Metro vs OdakyuSimilar revenueTokyo Metro margin 8.6pt higherCompare

- vs
 Keio vs Tokyo MetroKeio has 1.2x the revenueTokyo Metro margin 10.7pt higherTokyo Metro pays ¥0.76M moreCompare
- vsTokyo Metro vs KeiseiTokyo Metro has 1.3x the revenueTokyo Metro margin 11.0pt higherTokyo Metro pays ¥0.85M moreCompare

The Transportation industry now
30 companiesTokyo Metro is one of 30 Transportation companies we cover, #20 by revenue. Here is how the industry’s shares and company plans look:
- Industry shares, 1 year
- +6.8%All industries +14.9%
- Op. profit plan, this FY
- +2.1%All industries +13.0%
- Forecasts raised
- 6cut 1
- Industry op. margin
- 10.5%
- Tokyo Metro−10.7%
- Transportation (average)+6.8%
- All industries+14.9%
- Latest resultsYear to date through Q1, 18 companies combined: revenue +8.1%, operating profit +9.4% year over year. 16 are ahead of an even pace toward their full-year plan, 4 behind.
- Revisions6 raised and 1 cut this year's forecast. The biggest revision: Nippon Express (operating profit +20.0%).






Tags#Tokyo Metro earnings#Japanese railways#FY2027 results#Transportation#Real estate#Dividend stocks#LifeFit#Japanese stocks
Was this article useful?
Anonymous, no sign-up neededComments
The decline in transportation profit despite growth in passenger numbers and fare revenue is worth watching. A recovery in fare income alone may not be enough: Tokyo Metro's ability to absorb higher personnel and operating costs will be central to an earnings rebound.
Meanwhile, life and business services is gaining ground as a source of revenue beyond rail, with contributions from stores, advertising and mobile services all increasing. Investors will be watching how far growth in that business and real estate can offset higher costs in the railway operations.
Cite or share this article
Quoting is free, no permission needed — just credit the source
https://www.gyokaidigest.com/en/companies/tokyo-metro/report/2027-Q2
Related articles
Latest from Major Private Railways

Major Private Railways
Company
Tokyo Metro Co., Ltd.
TSE: 9023
This is the latest earnings analysis
Next earnings date
Rivals reporting soon
609 companies report in the next two weeks · see the scheduleLatest earnings coverage
- TRUSCOQ3 FY2026TRUSCO Q3 FY2026: Sales jump 12%, but profit growth trails

- NxeraQ3 FY2026Nxera Q3 FY2026: Returns to profit as partnership income grows

- Genki GlobalQ2 FY2027Genki Global Q2 FY2027: Revenue jumps 42%, profit falls

- transcosmosQ2 FY2027transcosmos Q2 FY2027: Revenue rises as earnings slide on investment

- GenkyQ1 FY2027Genky Q1 FY2027: Sales rise, but profits fall as costs mount
