
CMP Q2 FY2027: Profit jumps 26% as price hikes gain traction
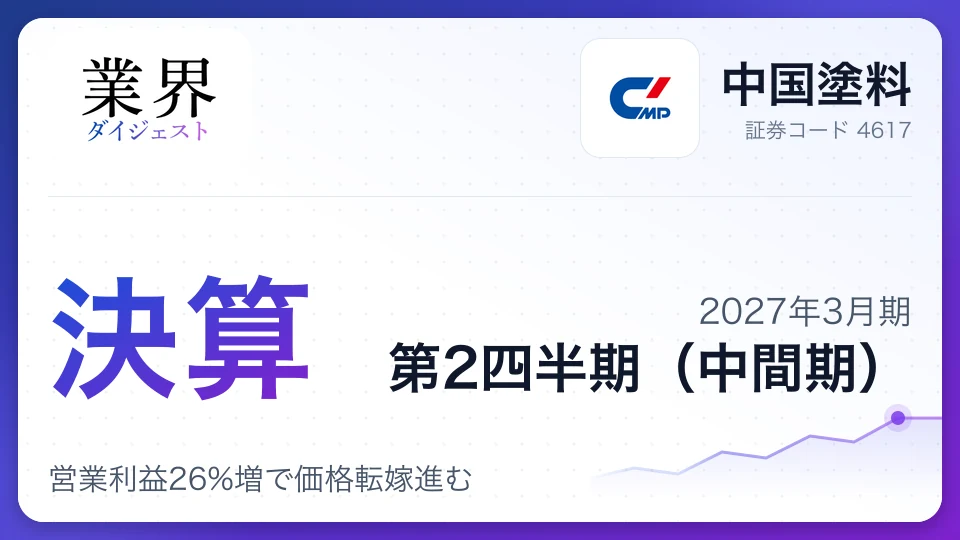
CMP's FY2027 first-half results showed revenue up 15.8% year on year, operating profit up 26.4% and net income up 33.5%. Stronger shipbuilding demand in China and Southeast Asia, along with price adjustments, supported growth despite rising costs.
The numbersSix months to date
First 6 months of the fiscal year, vs. a year earlier
| Actual | YoY | Full-year forecast | Progress | |
|---|---|---|---|---|
| Revenue | ¥79.3B | +15.8% | ¥160.0B | 50% |
| Operating profit | ¥11.4B | +26.4% | ¥20.0B | 57% |
| Net income | ¥7.9B | +33.5% | ¥13.0B | 61% |
| Operating margin | 14.4% | |||
Key takeaways
- 1Demand for newbuild vessels in China and in Southeast Asia strengthened, with revenue in the two regions up 34.5% and 34.9%, respectively, year on year.
- 2Japan segment profit increased by ¥2.099 billion, or 111.1%, year on year, helped by price adjustments.
- 3Europe and the U.S. recorded a 2.2% year-on-year revenue decline and a 76.8% drop in segment profit, highlighting diverging regional results.
- 4The full-year revenue forecast is ¥160 billion and the operating profit forecast is ¥20 billion. First-half operating profit progress was 57.2%.
- 5The annual dividend forecast is ¥100. The prior year's ¥111 included a ¥14 special dividend, making the latest forecast a ¥3 increase on an ordinary-dividend basis.
Earnings at a glance
CMP reported revenue of ¥79.342 billion for the six months ended September 2026, up 15.8% from a year earlier. Operating profit rose 26.4% to ¥11.437 billion, while net income attributable to owners of the parent increased 33.5% to ¥7.892 billion. Profit growth outpaced sales growth, lifting the operating margin to 14.4% from 13.2% a year earlier.
- Price adjustments: CMP revised prices, mainly in Japan, in response to higher raw-material, transportation and labor costs, improving profitability.
- Higher-value products: The company expanded sales of environmentally responsive products, including high-performance antifouling coatings, amid demand to reduce ships' CO2 emissions.
- Benefit from raw-material inventories: Cost of sales in the first half included materials procured before prices surged, partly cushioning the impact of higher costs on earnings.
- Improved non-operating income: The absence of foreign-exchange losses, among other factors, helped lift ordinary profit 36.4% to ¥12.023 billion year on year.
Price increases and a better product mix supported profit growth. However, raw-material costs are rising amid escalating tensions in the Middle East, and earnings could come under pressure in regions and product areas where price revisions lag. Sustaining the first-half momentum through the full year will depend on continued price pass-through and growth in sales of higher-margin products.
Segment performance
By region, revenue and profit grew in Japan, China and Southeast Asia, while profit declined in South Korea and Europe and the U.S. Japan and Southeast Asia posted the strongest year-on-year profit growth, while the downturn in Europe and the U.S. was pronounced.
Japan: Revenue rose 21.5% year on year and segment profit increased 111.1%. Shipments of marine coatings remained firm, while price adjustments in response to higher raw-material costs and growth in heavy-duty industrial coatings also contributed.
China: Revenue increased 34.5%. Shipments for newbuild vessels rose substantially, and higher-value products for vessel repairs also grew. Segment profit, however, fell 3.7% amid higher raw-material costs and other factors.
Southeast Asia: Revenue rose 34.9% and segment profit advanced 77.2%. Demand for vessel-repair coatings and strong heavy-duty coating projects in Thailand, as well as pricing that reflected costs, boosted profit.
South Korea: Revenue declined 6.0% and profit fell 10.7%, reflecting the comparison with a year-earlier period when large projects were concentrated, as well as delays in shipyard schedules. Europe and the U.S.: Revenue fell 2.2% and profit dropped 76.8%, due to fewer vessel repairs and weaker European profitability amid a stronger euro. Growth in key regions offset declines in Europe and the U.S., but restoring profitability in those markets remains a challenge.
- Japan+111.1%
- China-3.7%
- South Korea-10.7%
- Southeast Asia+77.2%
- Europe and the U.S.-76.8%
| Segment | Revenue | Share | Operating profit | Operating margin |
|---|---|---|---|---|
| Japan | ¥27.1B | 34% | ¥4.0B | 14.7% |
| China | ¥14.6B | 18% | ¥1.5B | 10.6% |
| South Korea | ¥9.0B | 11% | ¥1.2B | 13.4% |
| Southeast Asia | ¥12.5B | 16% | ¥3.3B | 26.5% |
| Europe and the U.S. | ¥16.2B | 20% | ¥213M | 1.3% |
Full-year outlook
CMP revised its consolidated forecast for FY2027, projecting revenue of ¥160 billion, operating profit of ¥20 billion and net income attributable to owners of the parent of ¥13 billion. All three figures are forecast to increase from the previous year. First-half operating profit reached 57.2% of the full-year forecast.
| Item | Full-year forecast | Year-on-year change | First-half result | Progress rate |
|---|---|---|---|---|
| Revenue (¥ million) | 160,000 | +14.8% | 79,342 | 49.6% |
| Operating profit (¥ million) | 20,000 | +14.7% | 11,437 | 57.2% |
| Ordinary profit (¥ million) | 20,500 | +14.9% | 12,023 | 58.6% |
| Net income (¥ million) | 13,000 | +18.2% | 7,892 | 60.7% |
The company directed investors to its separately announced notice on the revision to its earnings forecast, but did not disclose the forecast figures before the revision. This report therefore presents the revised outlook and year-on-year comparisons. Profit progress is ahead of revenue progress, but continued raw-material inflation and differences in regional profitability mean price adjustments and a better sales mix will be key to meeting the plan in the second half.
Financial position and capital policy
Total assets stood at ¥169.233 billion at the end of September 2026, up ¥11.672 billion from the end of March. The equity ratio rose 0.4 percentage point from fiscal year-end to 61.0%, leaving CMP with a solid financial base.
| Item | End of September 2026 | Comparison | Change or details |
|---|---|---|---|
| Total assets (¥ million) | 169,233 | End of March 2026: 157,560 | +11,672 |
| Equity ratio | 61.0% | End of March 2026: 60.6% | +0.4 percentage point |
| Operating cash flow (¥ million) | 772 | Year-earlier period: 2,927 | Decreased |
| Investing cash flow (¥ million) | -330 | Year-earlier period: -660 | Lower outflow |
| Financing cash flow (¥ million) | -4,609 | Year-earlier period: -5,679 | Lower outflow |
Operating cash flow fell short of the year-earlier level despite higher pretax profit, as an increase in receivables and inventories coincided with corporate tax payments. Cash and cash equivalents totaled ¥34.929 billion at the end of the first half, down ¥3.128 billion from the start of the period.
The interim dividend was ¥50 per share, up ¥2 from ¥48 a year earlier. CMP forecasts an annual dividend of ¥100. The previous year's ¥111 included a special dividend of ¥14, so the latest forecast represents a ¥3 increase from the prior year's ordinary dividend of ¥97. There was virtually no cash outlay for share repurchases in the first half, and the earnings release did not mention a large-scale buyback.
Strategic developments
CMP plans to absorb its wholly owned subsidiary Kobe Paint on April 1, 2027. Kobe Paint also focuses on marine coatings, and CMP will remain the surviving company after the merger.
- Integrated operations: The companies plan to unify production, product brands and sales channels to streamline group management and improve operational efficiency.
- No shares or cash to be issued: As the merger is with a wholly owned subsidiary, CMP does not plan to issue new shares or provide cash consideration.
- Core corporate details unchanged: The company name, head office, representative, business activities, capital and fiscal year-end will not change.
Combining the two companies' operations is intended to eliminate duplication in manufacturing and sales and improve efficiency. Investors will be watching how far the integration delivers cost savings and strengthens the product and sales infrastructure.
Risks and challenges
Demand varies by region and application, and the ability to convert price pass-through into profit will be important as raw-material inflation and geopolitical risks persist. Trends in marine-coating demand and currency movements also warrant attention.
- Middle East tensions and raw-material prices: Continued supply uncertainty or higher material costs could weigh on margins in regions and product areas where price adjustments are delayed.
- Foreign-exchange fluctuations: A stronger euro against the U.S. dollar contributed to weaker profitability in Europe and the U.S. Continued currency moves could affect the performance of overseas operations.
- Shipyard schedules and vessel repairs: Temporary schedule delays in South Korea and fewer vessel repairs in Europe and the U.S. affected shipments. Concentration of projects and shifts in timing can make sales volatile.
- Higher working capital: Receivables and inventories increased, leaving first-half operating cash flow below the year-earlier level. If working capital continues to rise, cash generation could lag profit growth.
Share price around the earnings release
Close on earnings release (Oct 30, 2026)
¥3,515
Latest close (Oct 30, 2026)
¥3,515
Reference chart of daily closing prices, not real-time quotes (split-adjusted; weekly closes before the last year). Updated Oct 30, 2026.
Compare CMP with its rivals
Pay, results and share price side by side- vs
 Kansai Paint vs CMPKansai Paint has 4.2x the revenueCMP margin 4.1pt higherKansai Paint pays ¥0.81M moreCompare
- vs
 Nippon Paint vs CMPNippon Paint has 12.7x the revenueNippon Paint margin 2.0pt higherNippon Paint pays ¥3.20M moreCompare
- vs
 Mitsubishi Chemical vs CMPMitsubishi Chemical has 26.6x the revenueCMP margin 11.7pt higherMitsubishi Chemical pays ¥2.96M moreCompare
The Chemical industry now
60 companiesCMP is one of 60 Chemical companies we cover, #42 by revenue. Here is how the industry’s shares and company plans look:
- Industry shares, 1 year
- +24.8%All industries +14.9%
- Op. profit plan, this FY
- +24.1%All industries +13.0%
- Forecasts raised
- 19cut 0
- Industry op. margin
- 8.8%
- CMP−15.1%
- Chemical (average)+24.8%
- All industries+14.9%
- Latest resultsYear to date through Q1, 36 companies combined: revenue +13.3%, operating profit +51.0% year over year. 27 are ahead of an even pace toward their full-year plan, 4 behind.
- Revisions19 raised and 0 cut this year's forecast. The biggest revision: Osaka Organic (operating profit +45.3%).





Tags#CMP earnings#FY2027 Q2#Marine coatings#Shipbuilding demand#Price increases#Southeast Asia#Operating profit#Dividend#Japan stocks
Was this article useful?
Anonymous, no sign-up neededComments
CMP's strong results reflect more than rising demand for marine coatings. The company also adjusted prices to offset raw-material inflation and increased sales of higher-value products. Japan and Southeast Asia led profit growth, with improved pricing contributing to the gains.
However, increases in receivables and inventories meant operating cash flow did not keep pace with profit growth. In the second half, investors will be watching not only whether CMP meets its full-year targets, but also whether it converts sales into cash and restores profitability in Europe and the U.S.
Cite or share this article
Quoting is free, no permission needed — just credit the source
https://www.gyokaidigest.com/en/companies/chugoku-marine-paints/report/2027-Q2
Related articles
Latest from Paint Makers
- EarningsKansai PaintQ1 FY2027Kansai Paint Q1 FY2027: Sales up, profit dips, but full-year forecast raised
- EarningsMitsubishi ChemicalQ1 FY2027Mitsubishi Chemical Q1 FY2027: Core operating profit doubles, lifts H1 outlook
- EarningsFujifilmQ1 FY2027Fujifilm Q1 FY2027: Revenue up 10% but profit plunges 32%; full-year sales raised
- Business TransferFujifilmSep 9, 2026Fujifilm: To streamline graphic segment, it will consolidate printing plate manufacturing in Japan and sell overseas facilities.
Company
Chugoku Marine Paints, Ltd.
TSE: 4617
This is the latest earnings analysis
Next earnings date
Rivals reporting soon
609 companies report in the next two weeks · see the scheduleLatest earnings coverage
- TRUSCOQ3 FY2026TRUSCO Q3 FY2026: Sales jump 12%, but profit growth trails

- NxeraQ3 FY2026Nxera Q3 FY2026: Returns to profit as partnership income grows

- Genki GlobalQ2 FY2027Genki Global Q2 FY2027: Revenue jumps 42%, profit falls

- transcosmosQ2 FY2027transcosmos Q2 FY2027: Revenue rises as earnings slide on investment

- GenkyQ1 FY2027Genky Q1 FY2027: Sales rise, but profits fall as costs mount
